



Real-time transparency
Quickly show what is operational, under maintenance or temporarily unavailable.
Show the health of services, APIs and channels in the same portal where customers already look for help. Communicate incidents, maintenance and recovery clearly, in real time.
Everything you need to communicate availability
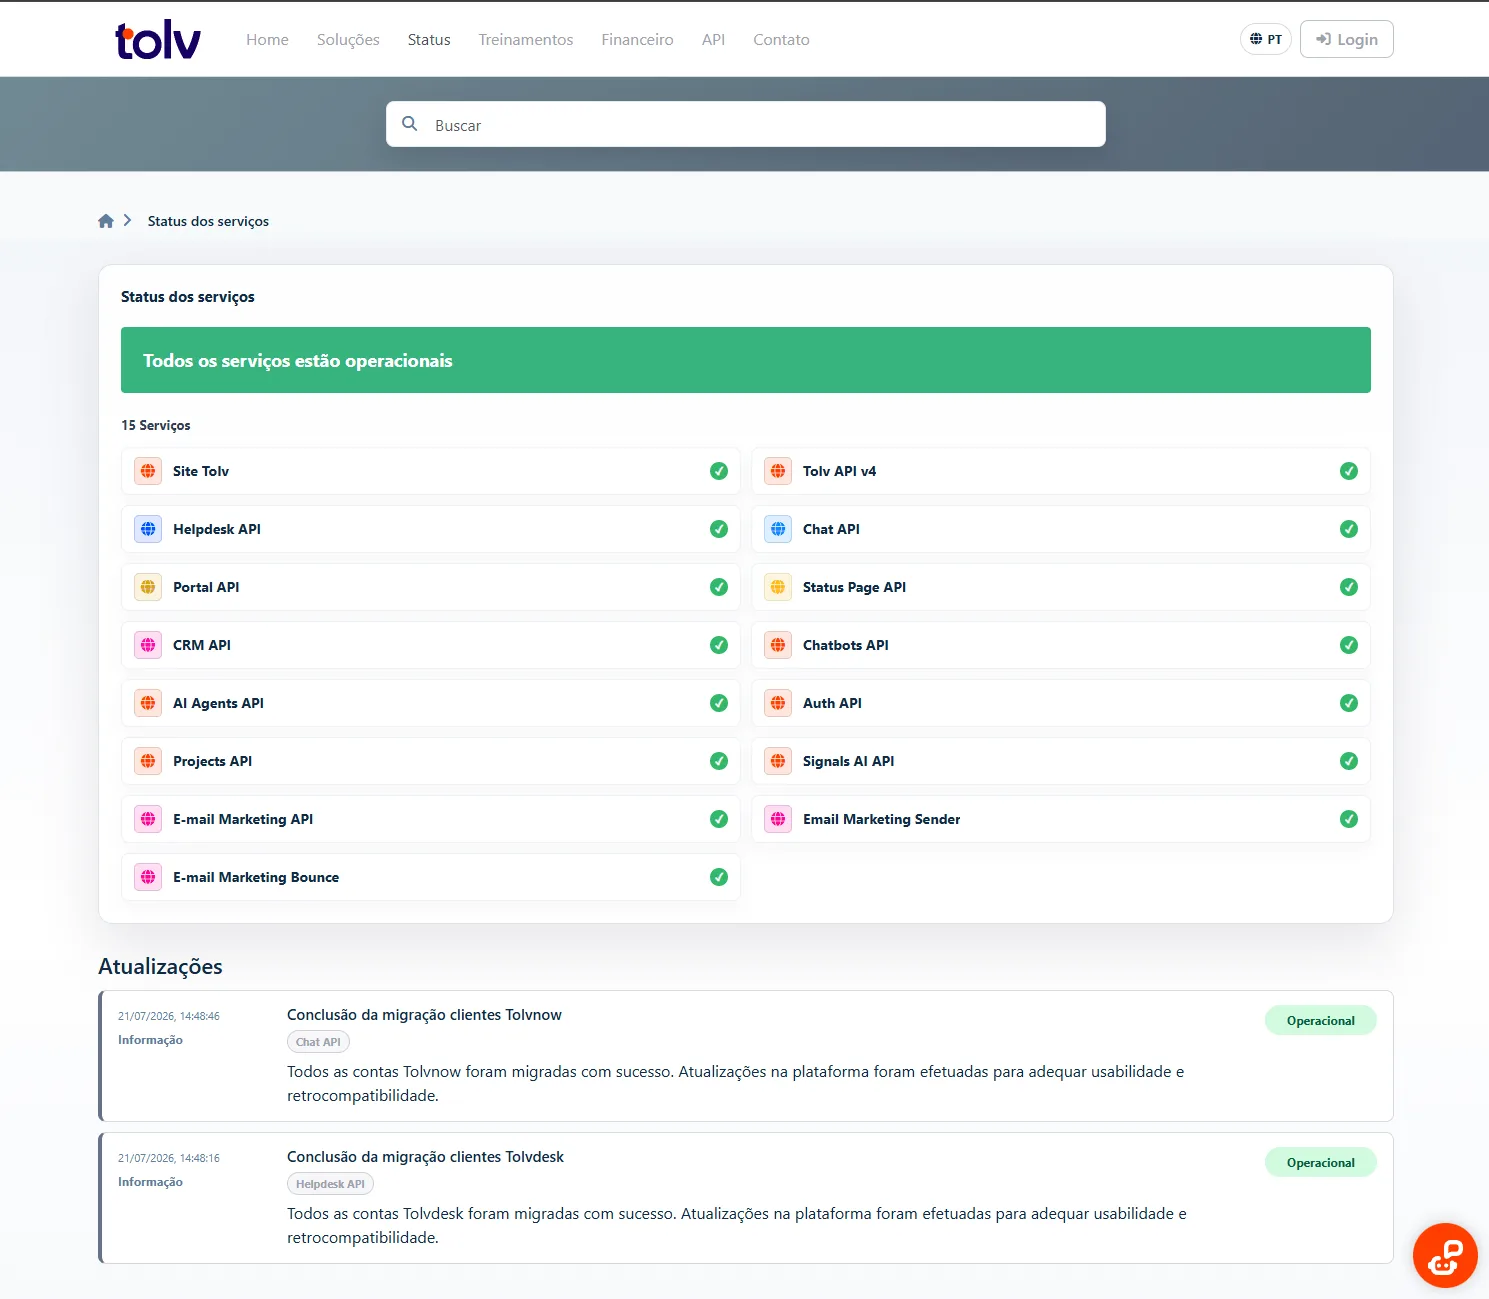
A simple, official and always-available source reduces uncertainty during incidents and helps your team communicate consistently.
Quickly show what is operational, under maintenance or temporarily unavailable.
Reduce contacts about outages by keeping information in one place.
Clear communication reduces uncertainty and demonstrates care for the customer experience.
No isolated experience. The status page uses your Customer Portal navigation, brand and access rules, alongside the knowledge base, tickets, chat and contact channels.
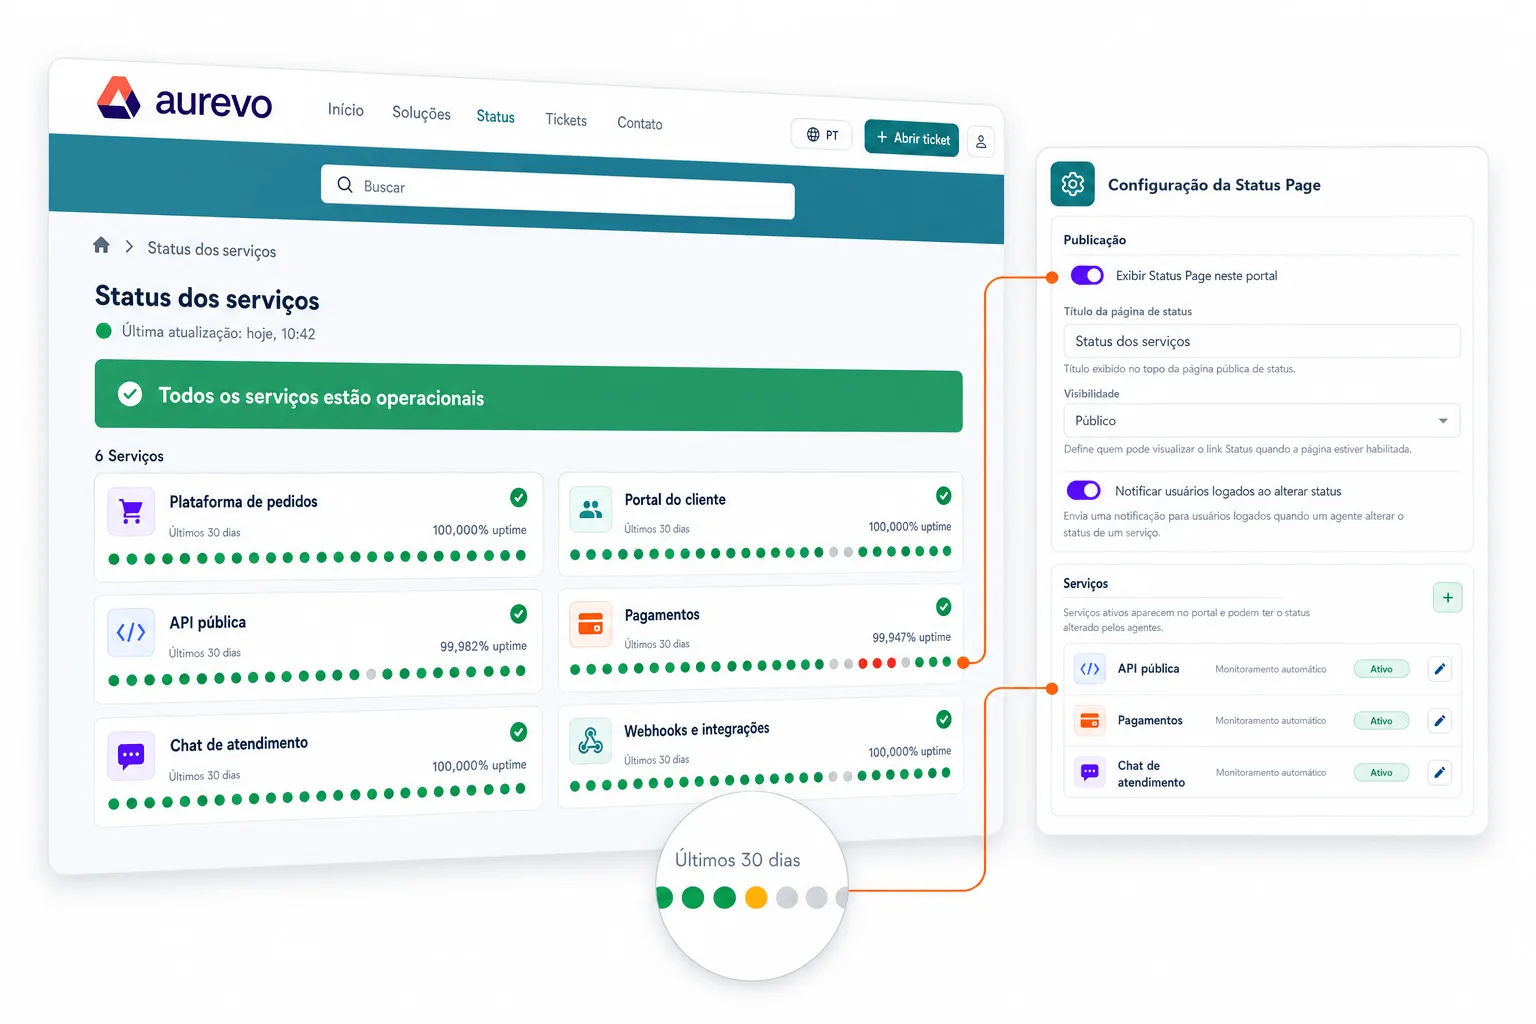
Monitoring helps identify downtime and turn technical information into clear public updates. Your team can respond quickly and keep everyone aligned throughout an incident.
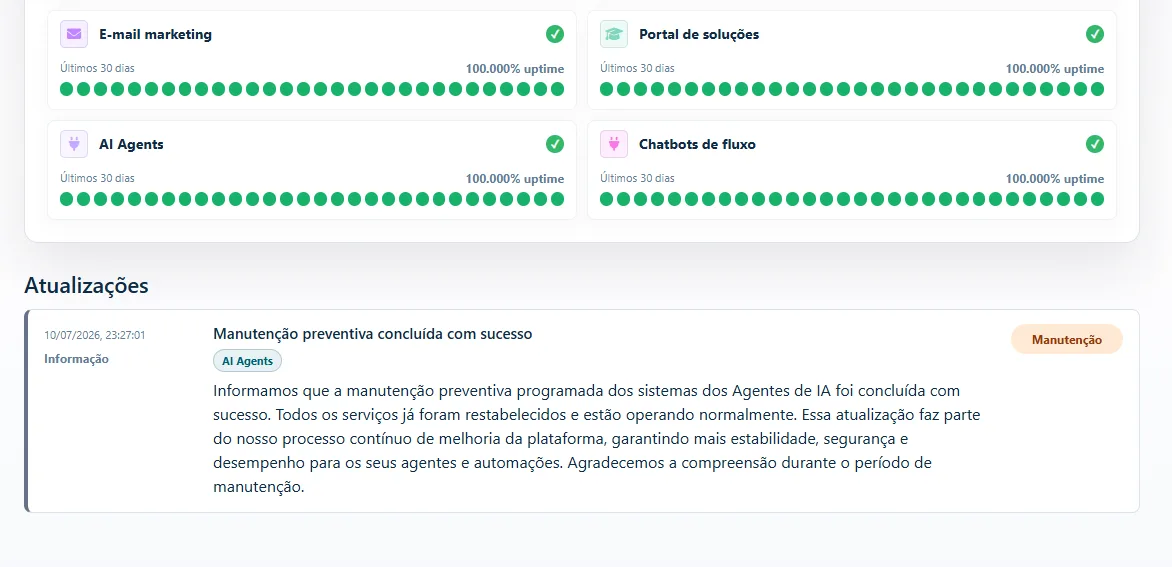
Your team follows technical signals, adds context and publishes objective updates to keep everyone aligned until recovery.
Track endpoints, latency, availability and certificates.
Receive signals about failures, degradation and exceeded thresholds.
Publish incidents, maintenance and contextual updates.
Announce recovery and preserve the full history for future reference.
The manager defines the services and check intervals. Tolv automatically performs the tests and sends alerts when it identifies failures or signs of degradation.
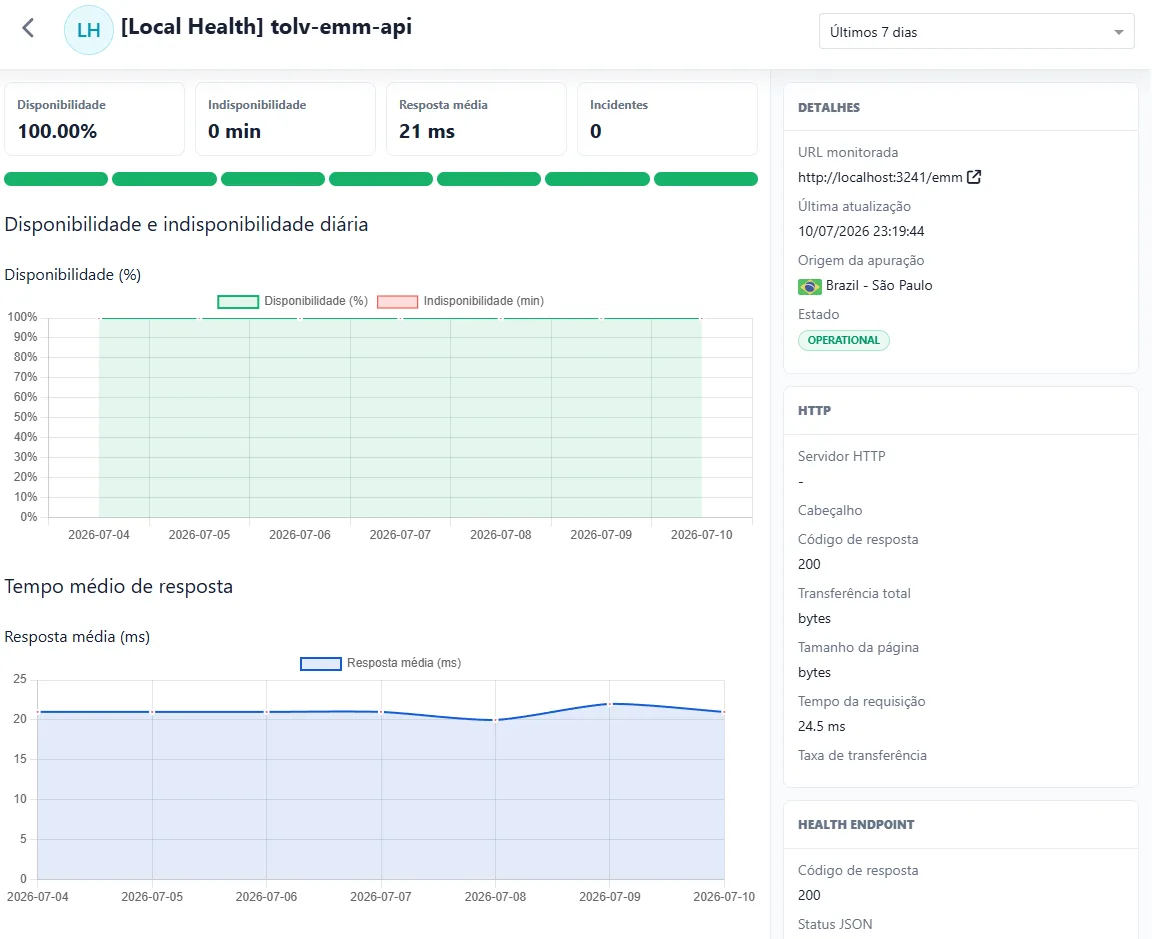
View how indicators evolve and keep customers and teams informed throughout the incident lifecycle.
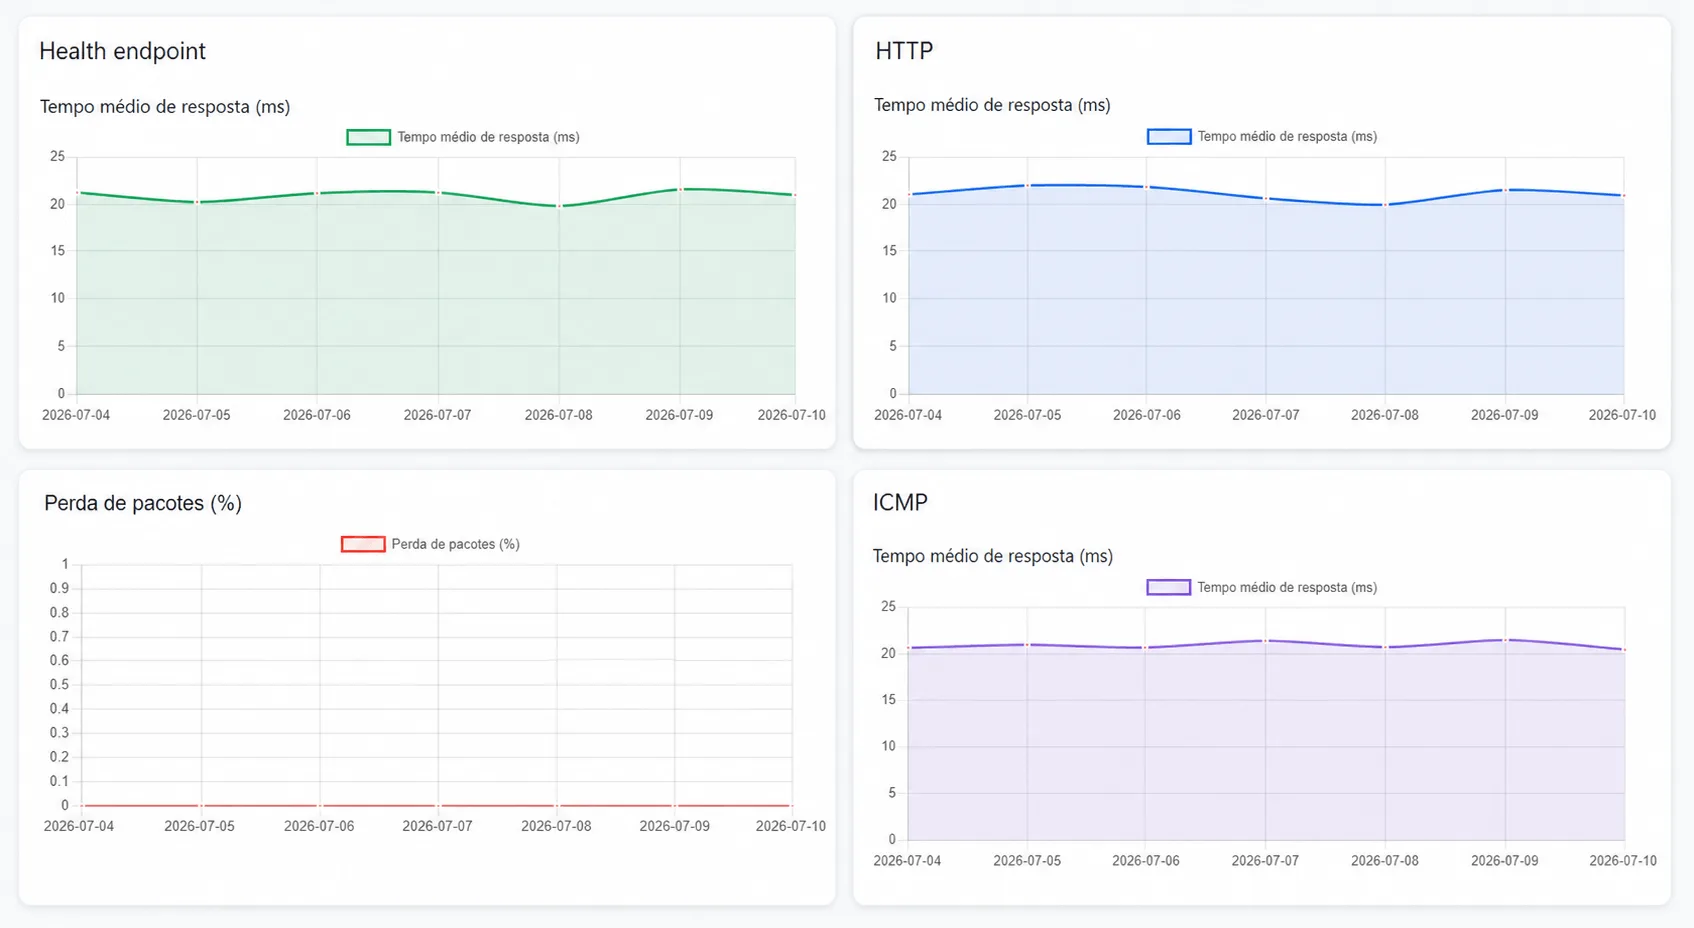
From the portal experience to technical details, each feature helps accelerate response and strengthen trust.
Availability, help and customer relationships in the same digital experience.
Share an open address where customers and partners can check service availability.
Restrict access when availability data is intended only for customers or authorized teams.
Organize APIs, channels, applications and integrations with individual statuses.
Record every change and keep an easy-to-browse history.
Notify customers in advance and track intervention progress.
Follow availability, latency, failures and degradation over time.
Apply the visual identity, navigation and look and feel of your Solutions Portal.
Get ahead of certificates that are close to expiring or already expired.
Bring the Status Page into your Customer Portal and turn operational data into clear, accessible communication aligned with your brand.
Access courses, tracks and practical content to accelerate platform adoption, standardize processes and prepare your operation to use chat, automation, AI, reports and integrations with more confidence.